Writing Task 1
Essential Information
When you write in Task 1, you must describe a type of chart or diagram in at least 150 words.
You will have roughly 20 minutes to complete it. This isn’t fixed, but it is recommended.
Task 1 is worth ⅓ of your Writing score.
What types of charts and diagrams could you have to describe?

Task Types
There are six types of diagrams you could have to describe. Read the brief description of each below, then follow the links for a more detailed analysis, tips, and model essays.
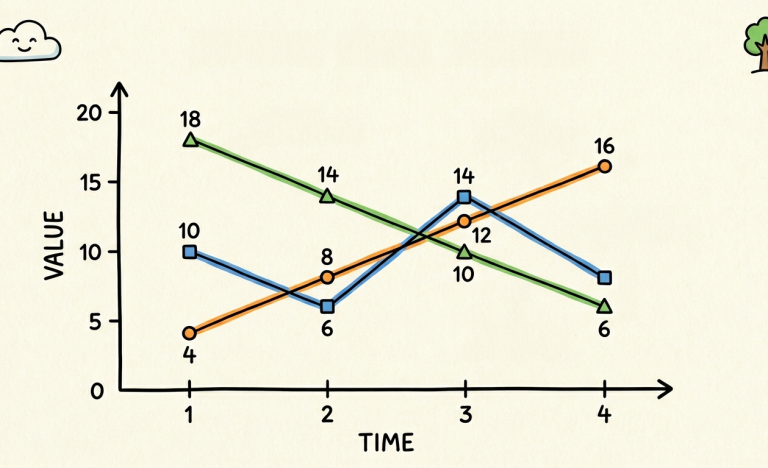
Line graphs show how data changes over a period of time. The X-axis almost always represents time, while the Y-axis shows amounts or percentages.
Your main focus here should be describing trends.
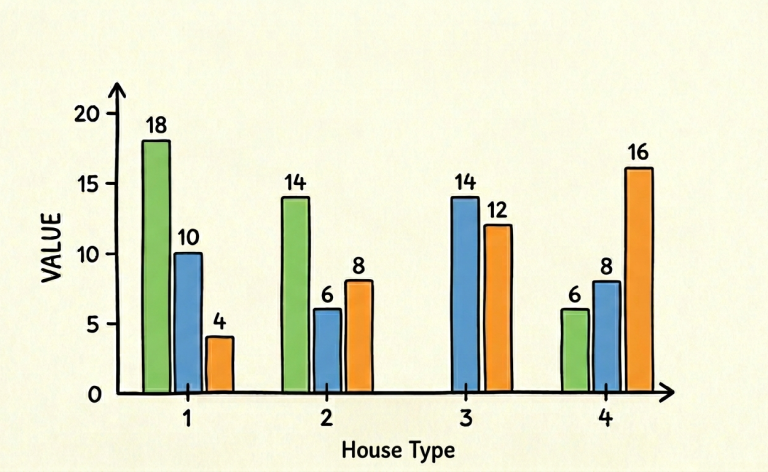
Bar charts compare different categories, amounts, or frequencies. They can be dynamic (showing changes over time) or static (showing a snapshot of data at a single point in time).
You will need to highlight the highest and lowest values and group similar data together.
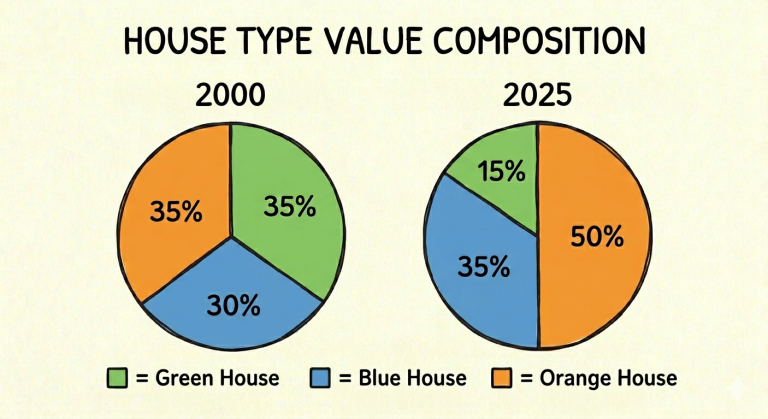
Pie charts represent percentages or proportions of a whole (totaling 100%). You'll need vocabulary for describing shares and fractions.
They can compare data across different years or look at a single point in time.
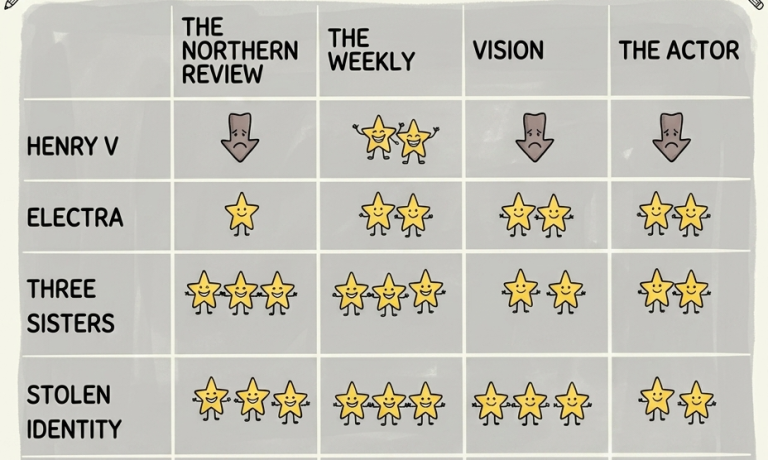
Tables present raw data, figures, or percentages in rows and columns without a visual graphic.
The challenge is selecting the most significant data points, identifying the highest/lowest numbers, and recognizing patterns.
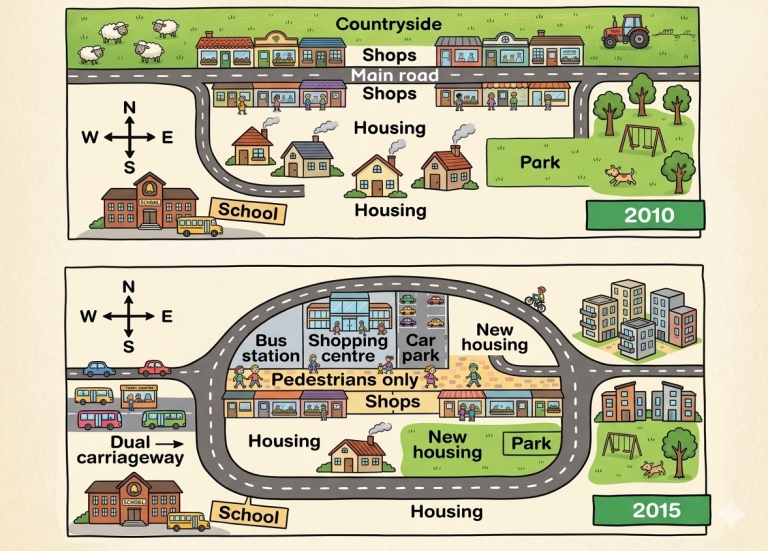
Map tasks usually show a specific location—like a village, a town, or a building layout—at two different times.
Your task is to describe the changes, developments, and urban transformations that have occurred, such as expansion, demolition, modernization, or relocation.
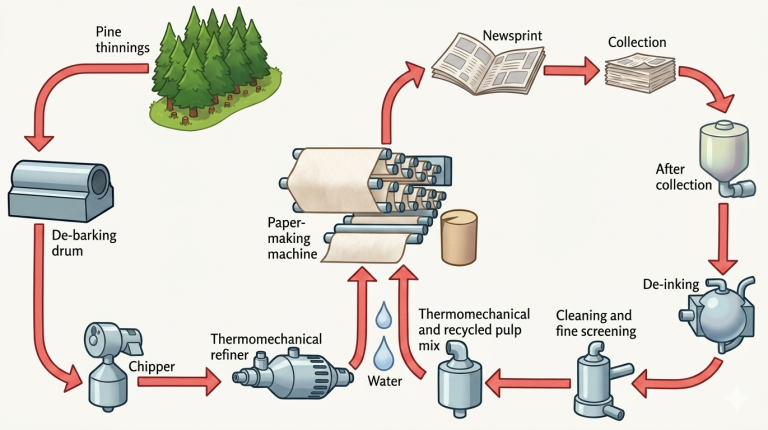
A process diagram shows a sequence of stages or steps in a cycle. This could be a natural or a man-made process.
The key here is to use sequential language (e.g., firstly, subsequently, following this) and passive voice.
Task 1 Response Strategy
The task type may change, but the instruction is always the same:
Summarise the information by selecting and reporting the main features, and make comparisons where relevant.
Step 1 - Paraphrase the title
Find the keywords in the title, think of improved synonyms or phrases and rewrite it for your 1st sentence.
Tip: Use the word 'depict' instead of shows (it's much more elevated!)
Step 2 - Give an overview
Write down an overview of the diagram, and do not quote data. This guarantees you above a high score for Task Achievement (see below).
An overview means what are the general trends you can easily see from the diagram.
Step 3 - Report main features
Your Body Paragraph #1 should include the most significant information. What's the highest value(s)? What's the biggest change in value?
Maybe you have two diagrams, so split it up by writing chronologically (in order of time).
In the case of a process, you start at the start!
Step 4 - Make comparisons
You want a high score?
You need to make comparisons between the data! How does one set of values compare to another?
Tip: Use cohesive devices like 'whereas' or 'conversely'.
Step 5 - No conclusion
Finally, do not write a conclusion. It is unnecessary.
Check your word count is above 150 and ensure you've used a range of vocabulary.
Make sure all significant data has been quoted, summarised and compared and then move on to Task 2!
Task Achievement
Evaluates if you accurately addressed the prompt.
You must present key features, make relevant comparisons, and use data correctly without including your own opinion.
Coherence & Cohesion
Assesses how logically your essay is structured.
You need clear paragraphing (aim for 3) and appropriate linking words (cohesive devices) to guide the reader.
Lexical Resource
A fancy word for vocabulary.
You are judged on your range of words, the natural use of collocations, and spelling accuracy.
The more varied and academic your language is, the better you will score.
Grammatical Accuracy
Evaluates sentence structure accuracy and range.
You need to use a variety of complex sentence forms while maintaining strict control over your grammar and punctuation.
Verbs tenses are important to maintain in Task 1.