Bar Charts
Bar Chart Top Tips
The vocabulary we use for bar charts is very similar to what we use for line graphs.
Except instead of speaking about a line; we speak about bars…
Bars can be horizontal or vertical, and can be positive and negative, but the language we use doesn’t change.
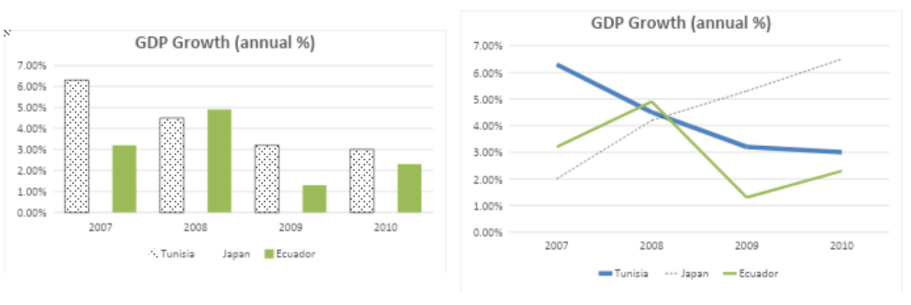
Bars can look like lines...
Bar Charts can be analysed in three different ways (when it isn't just change over time):
- Differences between categories
- Differences between values
- Differences between the bars
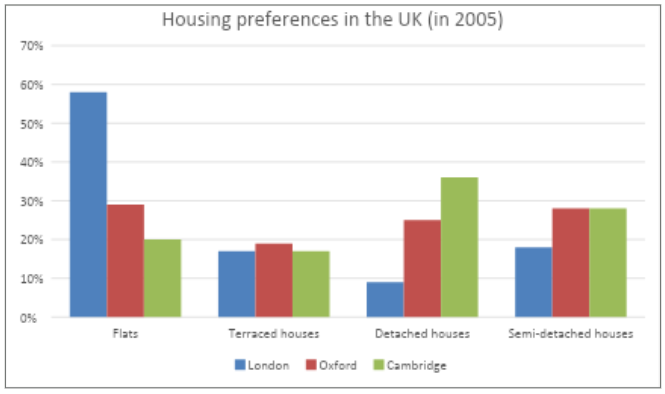
For example...
Here we can look at the differences between:
- The types of houses
- The cities
- Overall % values
Let's look at this bar chart in more detail below with a model essay.
Model Essay Example
Self-analysis tip:
Your essay should be so good that when someone else reads it, they are able to draw the graph.
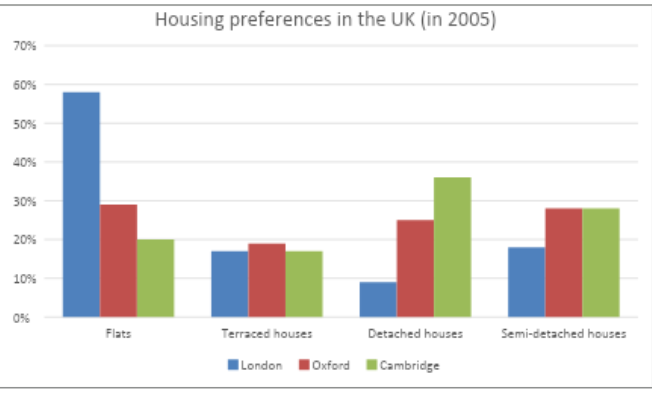
The bar chart depicts information regarding accommodation choices in three metropolitan areas in the UK in 2005. Overall, flats were the predominant choice of housing in London, whereas detached houses were the preferred option in Cambridge. In contrast, residential preferences in Oxford were much more evenly distributed.
As evidenced in the bar chart, flats were the most selected option in London, recording just under a 60% proportion. This stands in contrast to Oxford, where the preference for flats was exactly half that of London. In Cambridge, the percentage dropped even further to just 20%. Conversely, the population in Cambridge showed a stronger preference for detached houses at 35%, representing the highest figure for that city. Oxford and London registered significantly lower proportions for detached houses, at 25% and 9% respectively.
The category of semi-detached houses highlighted that both Oxford and Cambridge shared an identical popularity of 28%. At the same time, Londoners favoured this style of accommodation 10% less than the other two cities. Finally, terraced houses were uniformly chosen by residents across all three cities, accounting for approximately 18% to 19% of the total in each.
Structure & Task Achievement
Effective Overview: The introduction provides a very clear overview paragraph that correctly identifies the main contrast: flats dominate in London and Oxford, while detached houses are the top pick in Cambridge.
Logical Data Grouping: The essay groups the data logically by comparing the two most contrasting categories (Flats and Detached houses) in the second paragraph, and then handling the more uniform categories (Semi-detached and Terraced houses) in the final paragraph.
Accurate Data Points: The percentages cited (e.g., just under 60% for London flats, 28% for Oxford/Cambridge semi-detached) are precise and match the visual data.
Coherence & Cohesion
Strong Transitions: It uses effective contrasting transition words like "whereas", "Conversely", and "This stands in contrast to", which helps the reader follow the comparisons easily.
\Referencing: Phrases like "the other two cities" and "this style of accommodation" prevent repetitive language and maintain a smooth reading flow.
Lexical Resource
Varied Data Terms: Avoided repetition by alternating between proportion, preference, and percentage.
Advanced Collocations: Used precise, academic phrases like "equivalent popularity" and "stands in contrast to".
Grammatical Range & Accuracy
Complex Sentence Variety: Advanced structures like participle clauses ("...in London, recording just under...") and relative clauses ("...in Oxford, where preference...").
Tense Control: Maintained complete accuracy using the past tense throughout the entire essay.
Precise Comparisons: Demonstrated strong grammatical control when comparing mathematical data (e.g., "...favoured this style 10% less than the other two cities").
SCORE
TA - 8 or 9
CC - 8 or 9
LR - 8 or 9
GA - 8 or 9
Overall: 8 - 9
At worst, this essay would score an 8.
Why not an exact score?
In my experience, Writing scores can be incredibly subjective, and we don't want to lie!
If you wrote this kind of response in your exam, you would definitely be getting a very high score!