Pie Charts
Pie Chart Tips & Vocabulary
Although the structure is the same as with other Task 1 responses, there is some specific vocabulary to keep in mind.
Pie Charts always show 100%
Percentages & Proportions
Do not speak about exact numbers.
The vocabulary you need is about percentages (value), fractions and proportions (numbers in words).
You can calculate percentages and proportions accurately because the 'whole pie' will always be 100%.
Not 'pieces'. Segments.
Compare & Contrast
Don't write about pieces of a pie! It may sound correct, but it is not.
The pie chart is split into segments, or you could say sections.
Not slices or pieces!
Compare changes and trends from one pie chart to the other, especially if they are the same categories over time.
Contrast any differences between categories too.
Model Essay Example
Self-analysis tip:
Your essay should be so good that when someone else reads it, they are able to draw the graph.
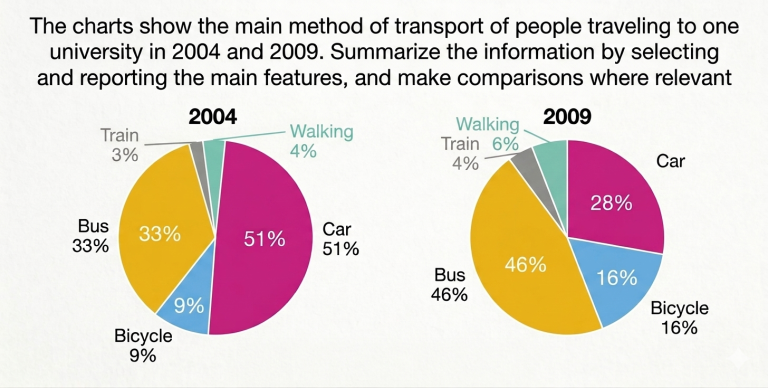
The provided pie charts illustrate the primary modes of transportation utilized by individuals commuting to a university in two specific years, 2004 and 2009.
Overall, a dramatic shift in commuting habits occurred over the five-year period. Private car usage, which was the dominant choice in 2004, saw a sharp decline by 2009, effectively being overtaken by public bus transit as the most popular means of travel.
In 2004, the car was by far the most preferred mode of transport, accounting for just over half of all commuters (51%). The bus followed as the second most prevalent choice, utilized by exactly one-third of the university population (33%). In contrast, green and alternative methods of travel were considerably less common; only 9% of people cycled to the campus, while walking and train travel registered negligible proportions at 4% and 3% respectively.
By 2009, the transport landscape had inverted. The proportion of commuters opting for the bus experienced a substantial surge of 13%, rising to 46% and becoming the leading transit method. Conversely, car reliance nearly halved, plummeting to just 28%. Meanwhile, eco-friendly commuting saw a noticeable upward trend: bicycle usage nearly doubled to 16%, and minor increases were recorded for both walking (6%) and train travel (4%).
Task Achievement
Clear Overview: The overview paragraph identifies the main, overarching story of the dataset: a complete structural shift from private car dominance to public bus transit dominance over the five-year period.
Data Grouping: Minor data points (walking and train travel) are logically grouped together as "negligible proportions," ensuring the essay focuses its main analysis on the most impactful changes.
Coherence and Cohesion
Logical Progression: The essay follows a clear structure: an introduction/overview, followed by a chronological breakdown (one body paragraph dedicated to the baseline year of 2004, and the final body paragraph detailing the transformations by 2009).
Conceptual Cohesion: Rather than relying heavily on repetitive, basic linking words (like Furthermore, In addition, or Secondly), the essay uses conceptual transitions that adapt to the data, such as "By 2009, the transport landscape had inverted" or "The bus followed as the second most prevalent choice."
Lexical Resource
Sophisticated Synonyms: The essay avoids repeating basic prompt words by incorporating precise alternatives like “modes of transportation,” “transit method,” “commuting habits,” “reliance,” and “cohort.”
Precise Verbs for Data Movement: Changes in percentages are described using precise vocabulary that accurately matches the scale of the movement (e.g., “plummeting,” “surged,” “nearly halved,” and “registered”).
Grammatical Range and Accuracy
Sentence Variety: The response blends a variety of advanced structures, ensuring the reading rhythm does not become monotonous.
Advanced Punctuation: The essay uses advanced punctuation—such as the strategic use of a colon to introduce a specific data breakdown—with accuracy.
SCORE
TA - 8 or 9
CC - 8 or 9
LR - 8 or 9
GA - 8 or 9
Overall: 8 - 9
At worst, this essay would score an 8.
Why not an exact score?
In my experience, Writing scores can be incredibly subjective, and we don't want to lie!
If you wrote this kind of response in your exam, you would definitely be getting a very high score!