Line Graphs
Tips & Recommendations
Line graphs are all about trends. How do the values change over time?
They are simple to read and get information from, therefore you must be accurate with your description, but also concise since you only have 150 words to play with.
Quote Figures
Identify the overarching movement (upward, downward, or fluctuating), note the major peaks and lowest points, and ignore minor changes.
Ensure that you are quoting directly from the line graph. Use 'approximately' when you can't be sure of the exact value.
You don't need to always do it, but you must quote specific reference to the values often enough.
Include an Overview!
You cannot score above a 5 for Task Achievement without an Overview sentence!
It is the general trend of the lines in the graph - whether that be increasing, decreasing, fluctuating, or stable.
Make comparisons between the lines if possible, especially if they have opposite trends.
Do Not Explain!
A very common mistake is to explain the data. In other words, to say why.
You don't need to care why. You just need to describe, summarise, and make comparisons where relevant.
Give no explanation, suggestion, or prediction.
Just say what you see.
Vocabulary Variety
Avoid repeating basic phrases like "went up" or "went down."
Use a mix of verbs and nouns paired with adverbs and adjectives (e.g., decreased sharply vs. a sharp decrease), and use precise terms like fluctuated, peaked, or stabilized.
Additionally, use approximation language (e.g., just under 50%, approximately 3,000) when a line falls between gridlines.
For more vocabulary advice, look below!
Describing The Line (Useful Vocabulary)
To achieve a high score, you need to use a wide range of vocabulary.
You don't just want to use verbs to describe changes either. Be specific and include accurate adjectives and adverbs too.

Line 'Going Up'
Verb
- To rise
- To increase
- To climb
- To grow
- To go up
- To rocket

Line 'Going Down'

Line 'Up & Down'

Line 'Steady'

Line 'Peaks'

Line 'Dips'
Noun
- A rise
- An increase
- A climb
- Growth
Verb
- To drop
- To decrease
- To fall
- To decline
- To go down
- To plummet
Noun
- A drop
- A decrease
- A fall
- A decline
Verb
- To fluctuate
- To oscillate
Noun
- A fluctuation
- An oscillation
Verb
- To remain/stay the same
- To remain/stay unchanged
- To remain/stay stable
- To remain/stay constant
- To remain/stay steady
Verb
- To peak
- To top out
Noun
- A peak
- A high
- A high point
- A maximum
Verb
- To dip
- To bottom out
Noun
- A low
- A low point
- A trough
- A minimum
Adjectives & Adverbs
Adjective
Dramatic
Sharp
Enormous
Steep
Substantial
Considerable
Significant
Moderate
Gradual
Slight
Minimal
Improve the accuracy of your description and level up your lexical score by using a range of adjectives and adverbs.
Adverb
Dramatically
Sharply
Enormously
Steeply
Substantially
Considerably
Significantly
Moderately
Gradually
Slightly
Minimally
Examples:
Teacher percentage gradually fell between the years 2001 and 2011 by 33%.
There was a dramatic increase in customer numbers from 1000 to 4000. Numbers fell steeply thereafter returning back to 1000 with by 3pm.
Model Essay Example
Self-analysis tip:
Your essay should be so good that when someone else reads it, they are able to draw the graph.
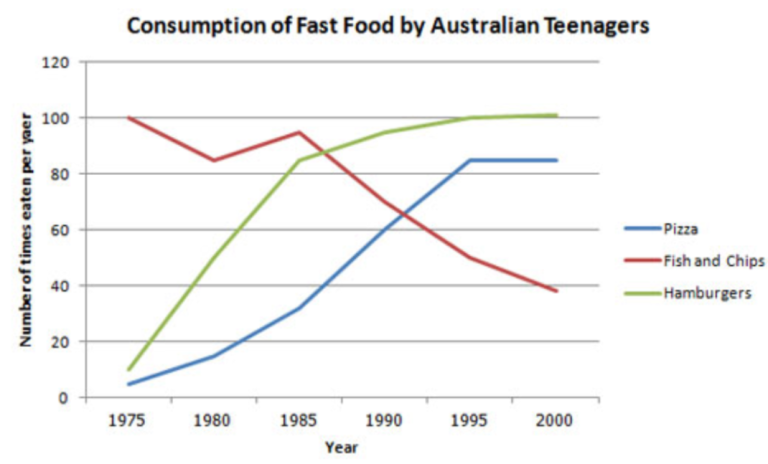
The line graph illustrates the amount of fast food consumed by teenagers in Australia between 1975 and 2000, a period of 25 years. Overall, the consumption of fish and chips declined over the period, whereas the amount of pizza and hamburgers that were eaten increased.
In 1975, the most popular fast food with Australian teenagers was fish and chips, being eaten 100 times a year. This was far higher than Pizza and hamburgers, which were consumed approximately 5 times a year. However, apart from a brief rise again from 1980 to 1985, the consumption of fish and chips gradually declined over the 25-year timescale to finish at just under 40 times per year.
In sharp contrast to this, teenagers ate the other two fast foods at much higher levels. Pizza consumption increased gradually until it overtook the consumption of fish and chips in 1990. It then leveled off from 1995 to 2000. The biggest rise was seen in hamburgers, increasing sharply throughout the 1970s and 1980s, exceeding fish and chips consumption in 1985. It finished at the same level that fish and chips began, with consumption at 100 times a year.
Structure & Task Achievement
Clear Overview: The introduction includes a clear overview: "Overall, the consumption of fish and chips declined...".
Identifying these overall trends immediately satisfies the requirements for a high band in Task Achievement.
Smart Data Grouping: Instead of just listing numbers chronologically, the essay contrasts the declining trend (fish and chips) with the rising trends (pizza and hamburgers).
This makes the essay cohesive and easy to follow.
Accurate Data Selection: Key milestones are correctly identified, such as the intersection points where hamburgers overtook fish and chips (1985) and where pizza did the same (1990).
Coherence & Cohesion
Seamless Transitions: Transitional phrases like "In sharp contrast to this", "However, apart from a brief rise...", and "whereas" are used accurately.
Referencing: The use of words like "this" and "the other two fast foods" avoids repetitive naming of the food items, keeping the flow smooth.
Lexical Resource
Paraphrasing: The essay skillfully varies its terminology to avoid repetition (e.g., “amount of fast food consumed”, “were eaten”, “was popular with”, “consumed approximately”).
Strong Collocations: Phrases like "gradually declined", "leveled off", "increasing sharply", and "25-year timescale" are precise, natural, and highly appropriate for data description.
Grammatical Range & Accuracy
Tense Agreement: Since the data is firmly set in the past (1975–2000), the past simple tense is used accurately throughout.
Complex Structures: The writer easily handles complex sentence structures, such as modifying clauses: "...exceeding fish and chips consumption in 1985. It finished at the same level that fish and chips began..."
SCORE
TA - 8 or 9
CC - 8 or 9
LR - 8 or 9
GA - 8 or 9
Overall: 8 - 9
At worst, this essay would score an 8.
Why not an exact score?
In my experience, Writing scores can be incredibly subjective, and we don't want to lie!
If you wrote this kind of response in your exam, you would definitely be getting a very high score!